
Call it the ‘butterfly debugger’. People at KansasFest 2018 were excited by the development possibilities of microM8’s ‘rewind’ feature – the one that lets you cheat at games by going back before you made a mistake and trying again. They pointed out that a programmer could go back before a crash and then rewind to just before it when all the conditions were exactly the same, and then step-through or trace the crash – this solves the reproducibility issue that plagues much of debugging.
Unfortunately, microM8’s debugger was non-existent. There was a machine-language monitor and not much else. And so we made it a priority to create a debugger – not just any debugger, but one that could rival the established players in the Apple II emulation space, with all the features a programmer would expect.
Since microM8 is written in golang and Go has a built-in web server, it seemed appropriate to make the debugger web-based. This allowed for the use of a Javascript interface framework to speed development and allow the debugger to provide more visible information than would be possible inside the emulation environment. And because it’s in the browser everything is point-and-click.
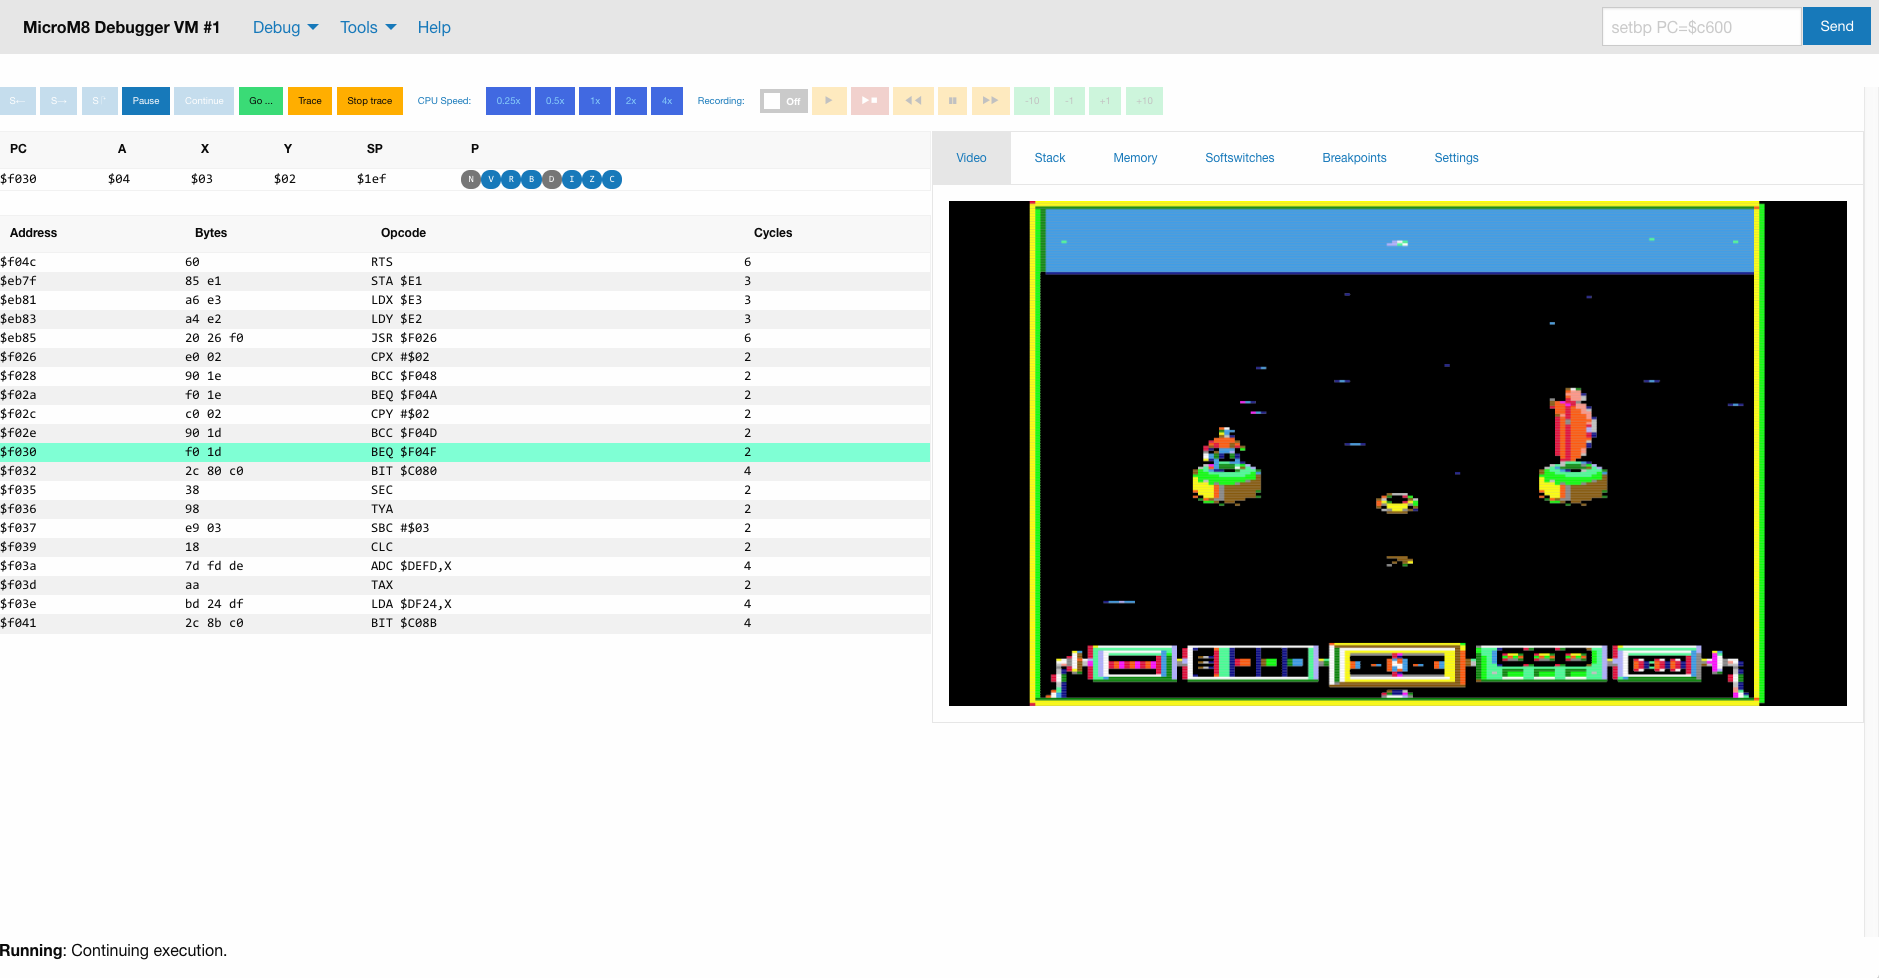
It made sense to have a video window so you could see what was happening on single-screen systems. There are controls across the top for stepping (in, out and over), managing traces (you can start and stop them whenever you like!), changing the CPU speed and, most importantly perhaps, for the recorder – the feature that makes our debugger different from everyone else’s.
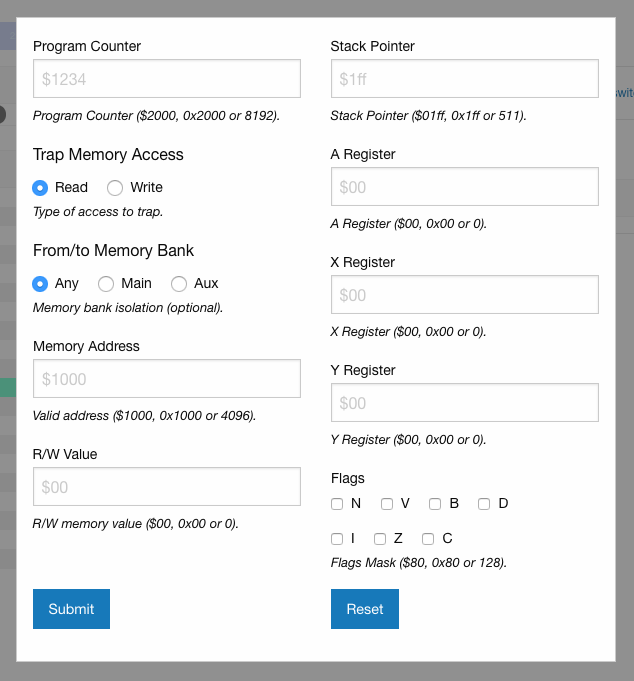
The stack, memory (viewing, searching and editing), softswitches, breakpoints and settings are all organised in tabs with the video reference image, so that the execution backlog, CPU state and lookahead information stays on the screen at all times. Recordings are saved to disk so you can go back to them anytime. The entire debugger state, including the state of memory, can be stored for later and retrieved. Memory blocks can be saved and loaded. Other notable features include the ability to search and set breakpoints in auxiliary memory, and the ability to change softswitches on-the-fly. You can even launch an Applesoft BASIC-based control program from the command line to manipulate your program and automate your debugging! (How cool is that?)
You can check out all the features on the debugger help page here: https://paleotronic.com/microm8/help/web-debugger/
You can download microM8 here: https://paleotronic.com/microm8/download/
Be the first to comment