
microM8’s web-debugger provides a number of handy debugging functions including a variety of break-points, stepping, memory editing, recording and rewind capabilities inside an easy-to-use web-based interface.
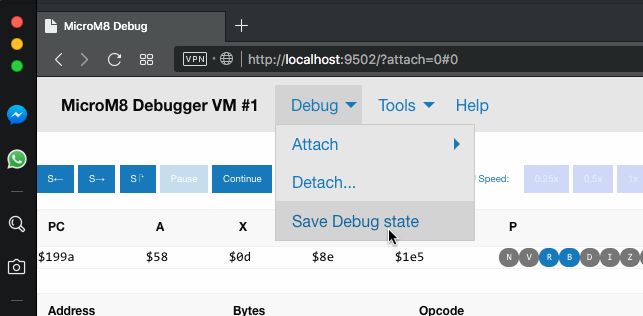
You can start the debugger by pressing Control-Shift-B once you boot an Apple II disk, or by opening the microM8 menu and navigating to Tools -> Web Debugger and selecting a VM (usually #1). The debugger starts paused.
Click on the images to view full-size.
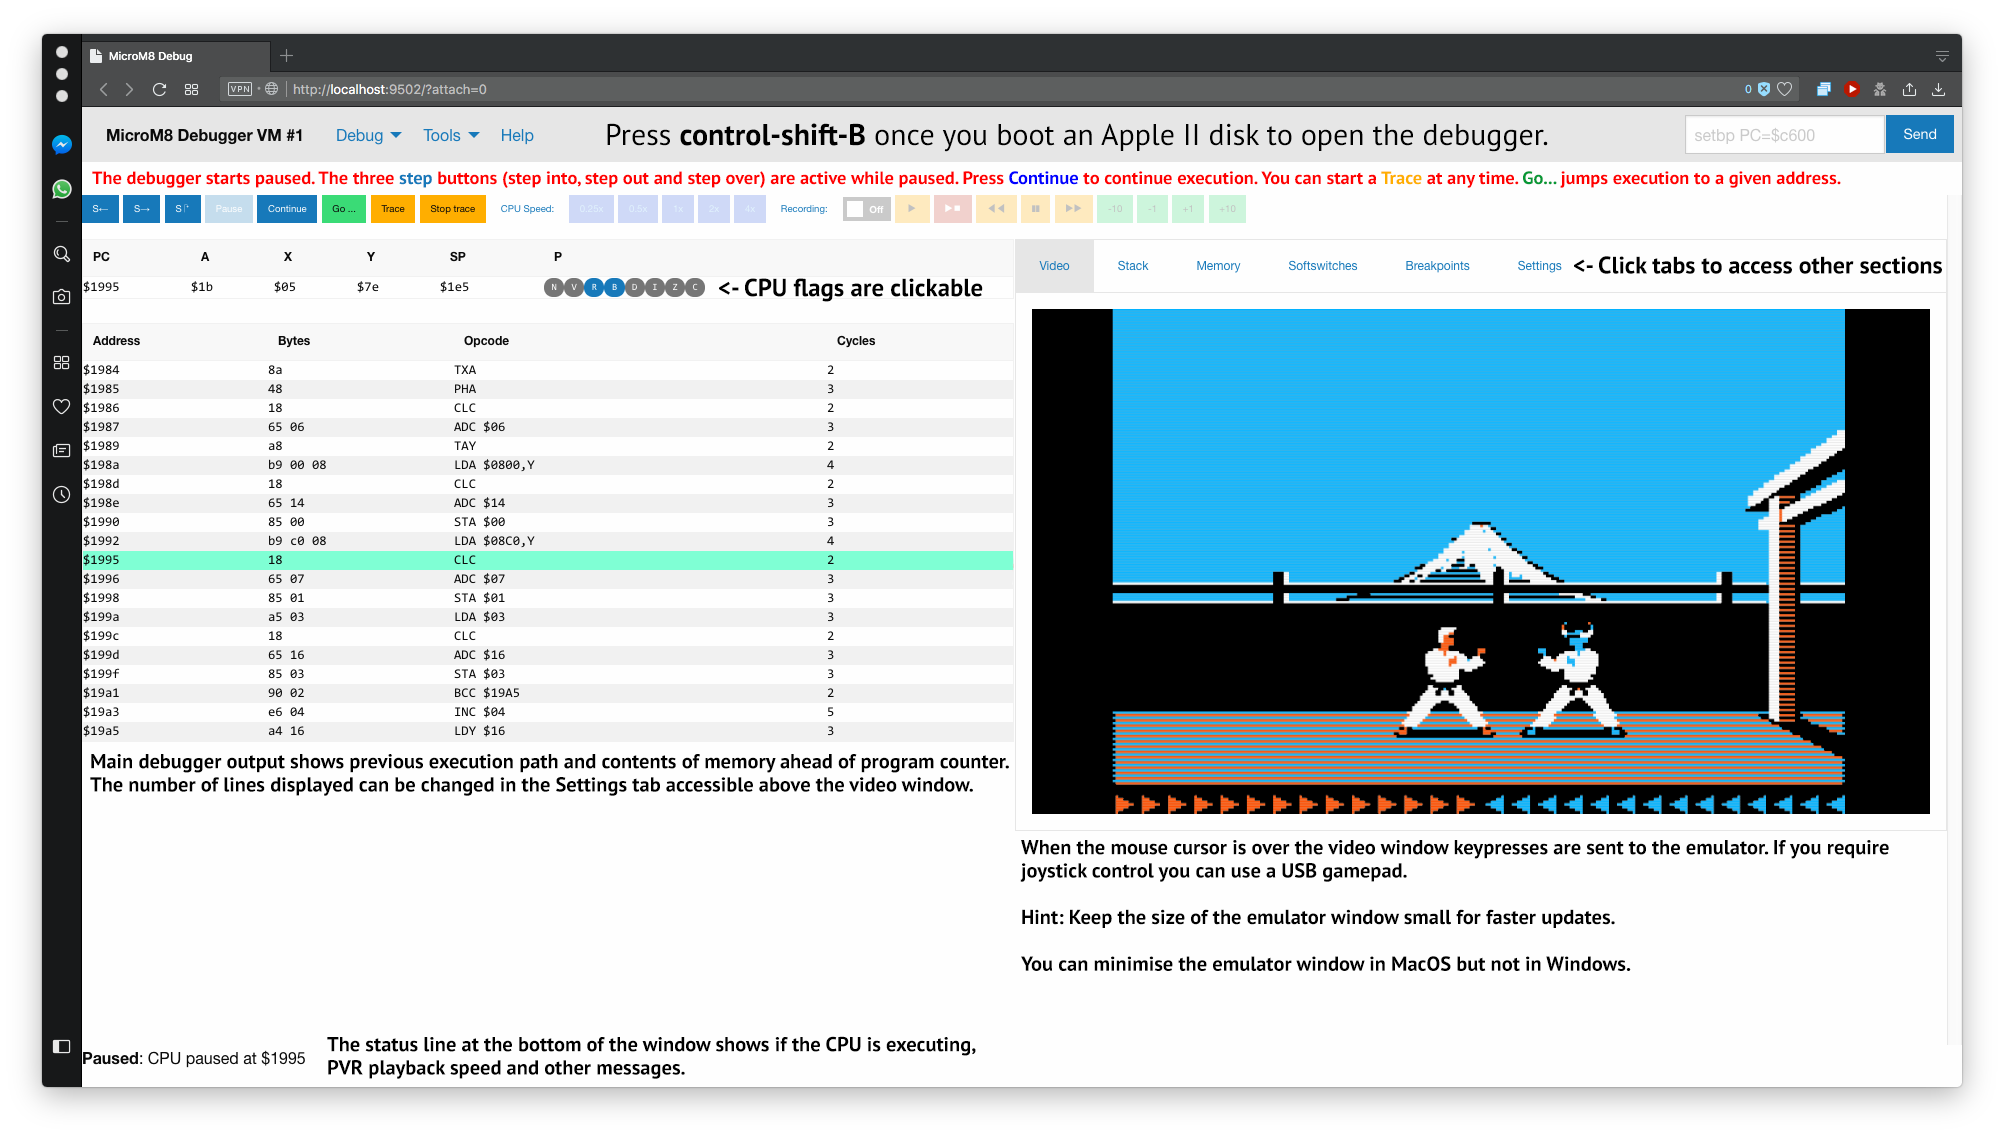 The debugger is designed to provide a constant view of the CPU state, program counter, recently executed instructions and memory lookahead. A tabbed section on the right-hand side provides panes for video representation, memory, softswitches, breakpoints and general settings. Along the top are a number of buttons related to CPU execution and speed, and recording and playback functionality.
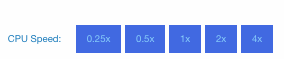
While the CPU is executing you can change its speed.
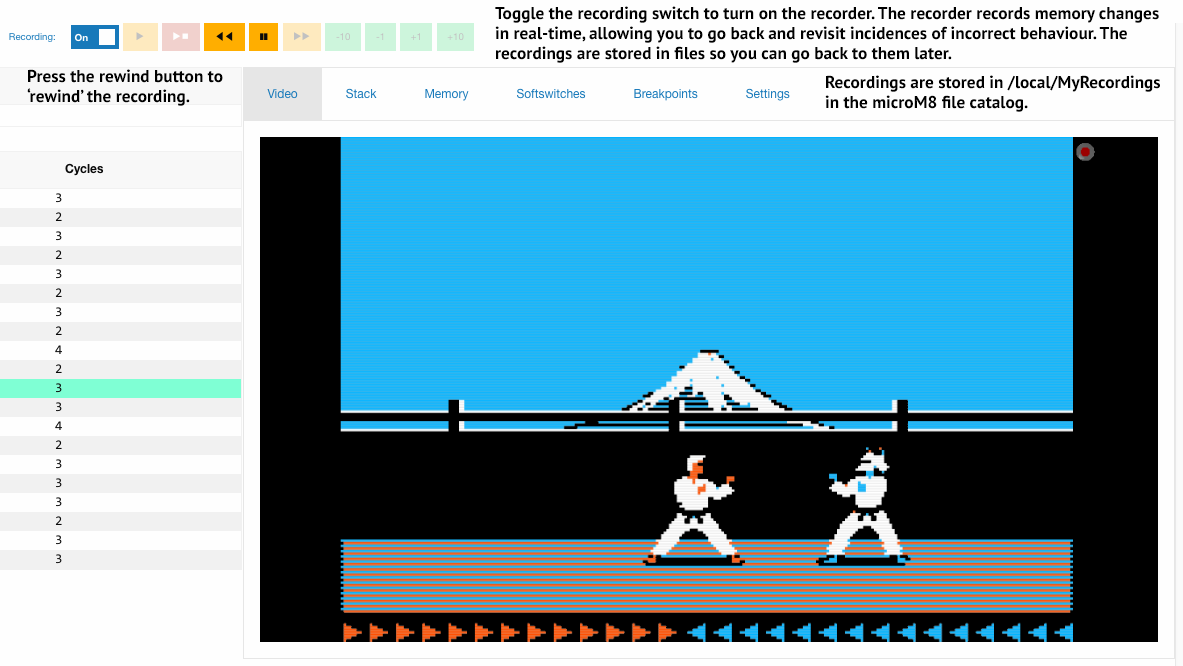
Using the recorder allows for easy revisiting of errors. You can travel back to just before the incident and then either trace or step-through execution to pinpoint exactly what went wrong. This is much easier than having to run a trace from scratch and hoping that the incident reoccurs (which as we know it often does not.)
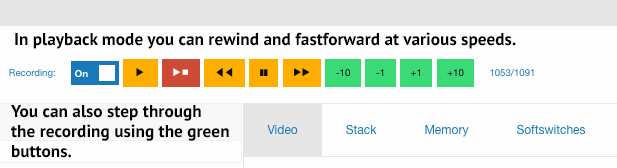
A number of controls are provided for playback. These allow for playback at various speeds in both reverse and forward, and stepping in one and ten recording intervals. An interval is by default 1/10th of a second (this is the resolution at which the CPU state is recorded, although memory changes are recorded in real time). You can change the interval timing in the Settings pane.
Using the controls you can travel back to precisely before the incident, saving time. The fast-forward and rewind buttons “shuttle” through various playback speeds, from 0.25X to 4X in both directions, for maximum efficiency.
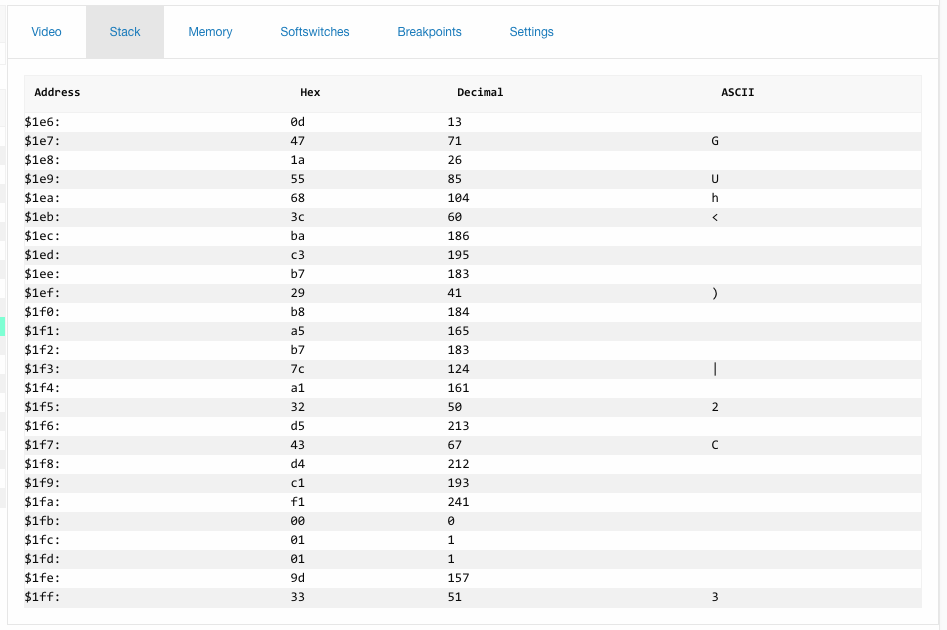
The stack pane shows the current state of the stack.
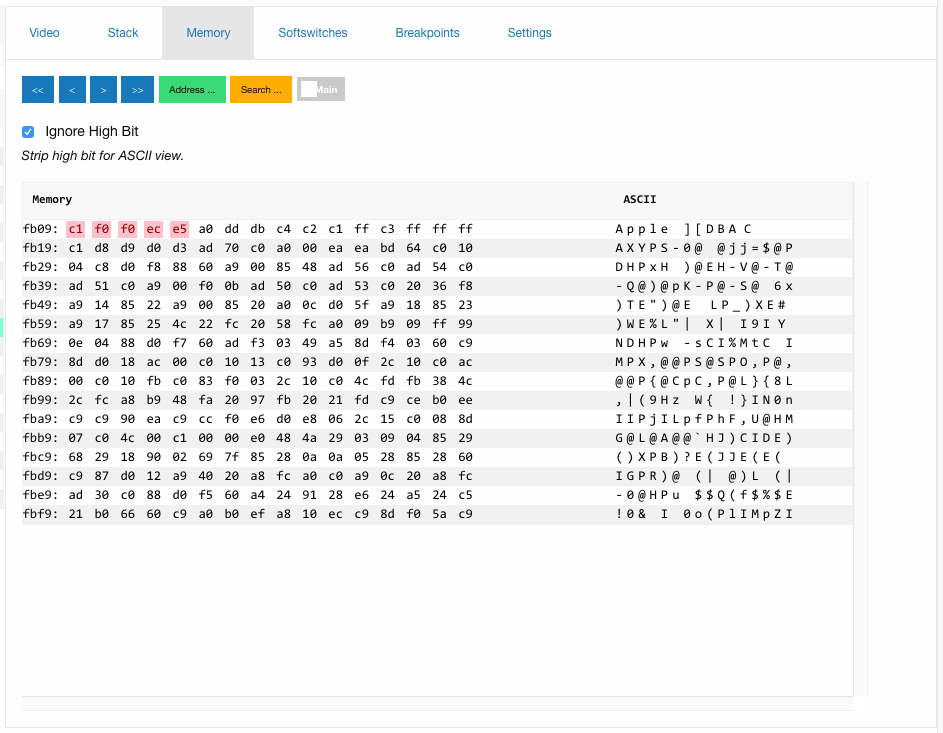
The memory pane allows you to inspect the emulator’s memory. You can double click on either the hex value or the ASCII character to change it. You can view either main or auxiliary memory banks by toggling the switch. You can step through memory with the blue keys or use the green Address key to jump to an address. The high-bit checkbox ignores the high-bit in ASCII rendering.
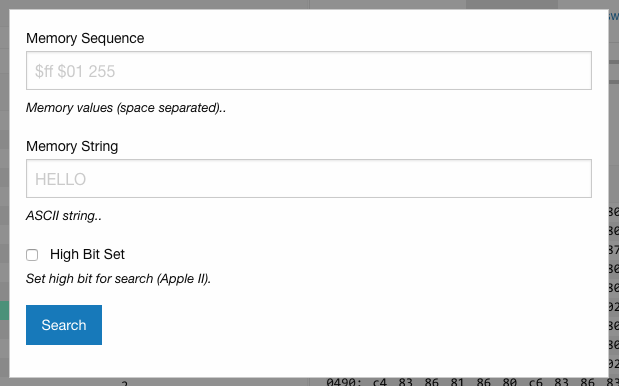
Clicking the Search… button brings up a dialogue which allows you to search the memory for a string or series of values.
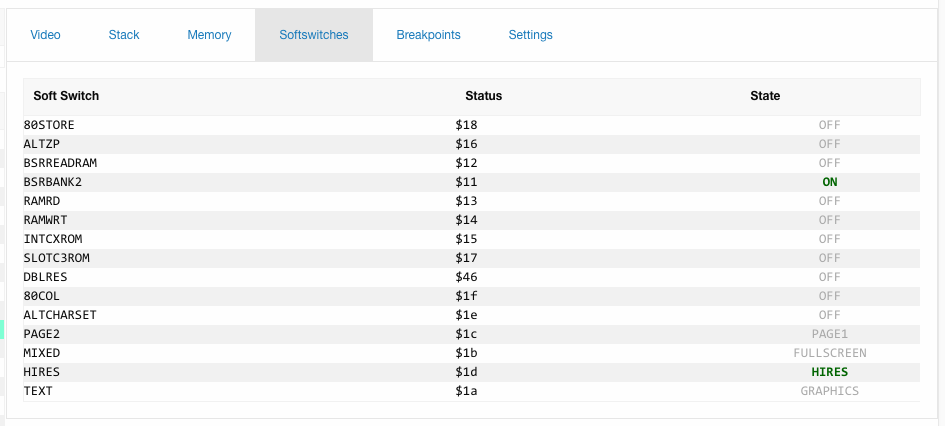
The softswitch pane displays the state of the Apple IIe softswitches. The ‘state’ values can be toggles by clicking on them. This can let you see what other graphics pages ‘look’ like, for example. However, toggling some of the switches may lead to instability and cause a program to crash.
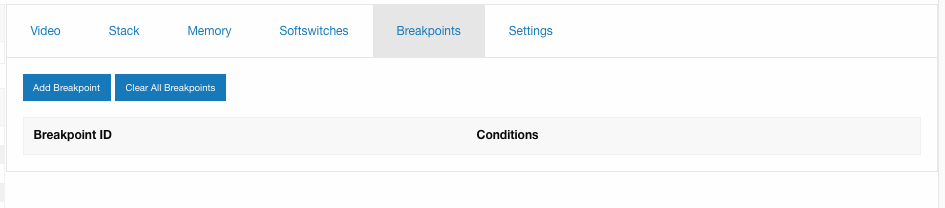
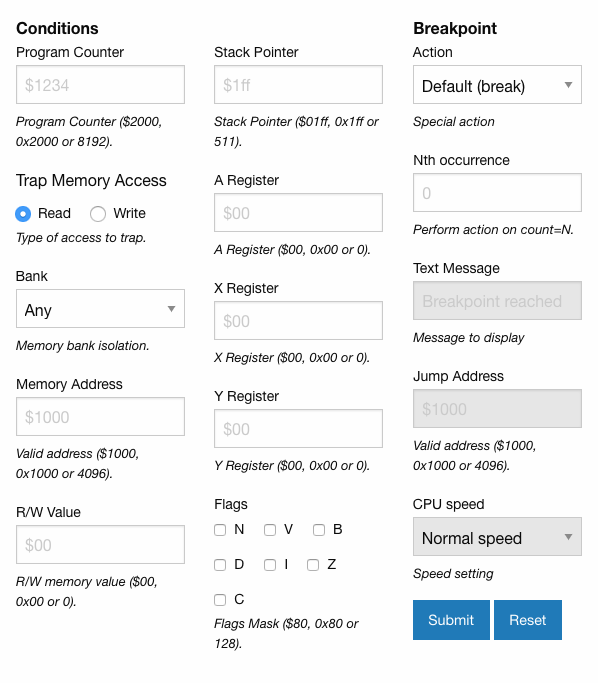
 The Breakpoints tab lists the currently active breakpoints. Clicking ‘Add Breakpoint’ opens the following dialogue, which provides a wide variety of breakpoint parameters to choose from, including the ability to distinguish between main and auxiliary memory.
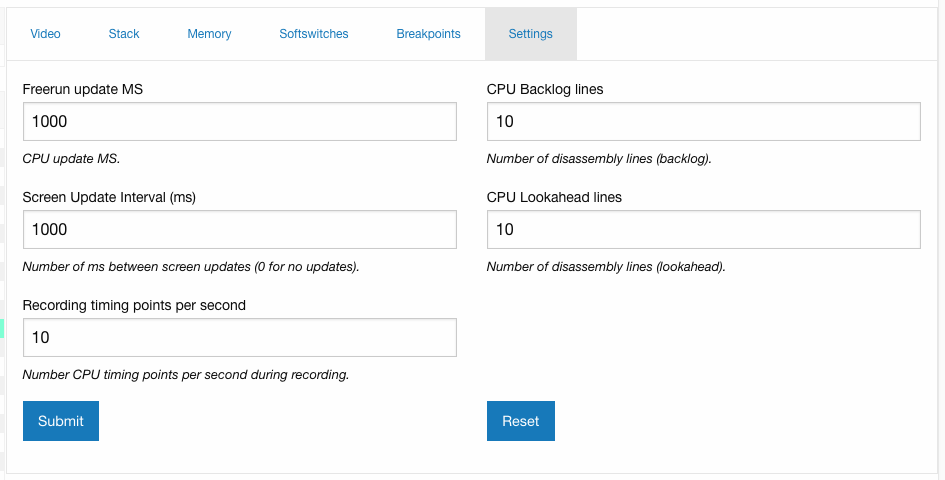
The settings tab allows you to set the update frequency of the main debugger output (execution path, lookahead etc) and the emulator video pane. You can set the number of lookahead and backlog lines. You can also adjust the resolution of the CPU recording. These are not persistent, but are saved if you save the debugger state using the menu (see below).
NOTE: There is now a 100% recording mode that captures EVERYTHING (not shown) activated via a checkbox in this tab. Warning: this mode uses up A LOT of disk space!
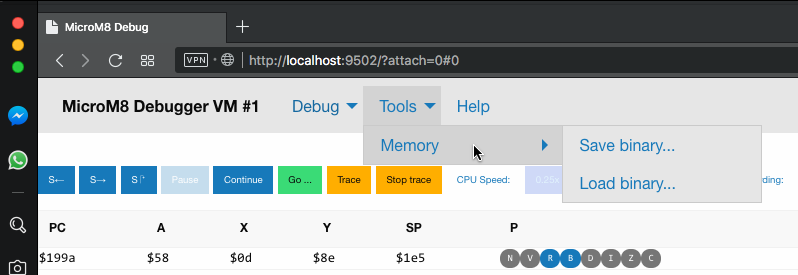
Finally, you can load and save blocks of memory using the appropriate menu options.

You can also use command-line flags to automatically launch disks and the debugger, and run a control program to automate debugging.

There’s also a heat map, so you can see where the emulated system is accessing memory